
The Real Cost of Investing in ETFs
What you actually pay
Building a portfolio comes down to a handful of dimensions: what you hold, how it’s spread across regions and sectors, how long you stay invested, and how much the holding costs you each year. The first three get most of the airtime. The fourth tends to be quoted as a single small number on a fact sheet, which makes it easy to underweight in the planning and easy to miss in the statements.
ETF costs split into two kinds, and each is handled differently. Trading costs are paid each time the investor buys or sells, going to the broker, the exchange, or the FX desk, and only when a trade actually happens. Holding costs are paid continuously, just for owning the fund, deducted from the fund’s own assets and baked into the quoted price.
They scale differently, so they have to be tracked differently. Trading costs scale with how often the investor transacts. Holding costs scale with how long the position is held. A percentage rate plus a per-order minimum covers the first. Each ETF’s published TER, short for Total Expense Ratio, covers the second. None of these pieces is itemised on a trade confirmation in a way that adds up to the real bill, and a half-percent annual drag that looks like rounding error in any one year reduces final wealth by tens of percent over twenty-five.
What’s inside a trade
Commissions are usually a percentage of trade value, say 0.10%, subject to a per-order minimum that can dominate the cost on small trades. Exchange and regulatory fees are modest per-order charges levied by venues and regulators. FX conversion costs apply when the investor buys an asset denominated in a foreign currency, and the spread applied at conversion can easily exceed the explicit commission. Fund the account in EUR, buy a USD-priced ETF, and the broker applies a markup to the spot rate before settling the trade. Competitive EU discount brokers sit in a tight 0.03%–0.25% band: IBKR around 0.03% on auto-conversion, Trade Republic and Trading 212 around 0.15%, DEGIRO at 0.25%. Traditional banks and full-service brokers run 0.5%–1.0%. At a bank, on a non-EUR trade, the FX markup usually costs more than the commission itself.
The bid-ask spread is the gap between the buy price and the sell price, and the investor pays roughly half of it on each leg of a round trip. Market impact is the price moving against the order when its size is large relative to what’s resting in the book, which is small for retail-sized trades in liquid ETFs and meaningful for everything else.
Schwarz et al. (2025), in the Journal of Finance, found that the average cost of buying and immediately selling a stock at major US retail brokers ranged from 0.07% to 0.46% with no commission charged. That figure is spread and execution quality alone, paid silently on every trade, broker-dependent and invisible to the customer. Zero commission is not the same as zero cost.
Why small trades are expensive
A broker’s cost to process a trade is roughly fixed regardless of trade size, covering routing, clearing, settlement, and reporting. A 0.1% commission on a €100 order works out to €0.10, which doesn’t cover the back-office work behind it. To keep small orders from running at a loss, brokers attach a per-order minimum: roughly €1 at competitive discount brokers, €2–€5 at traditional ones, more at banks.
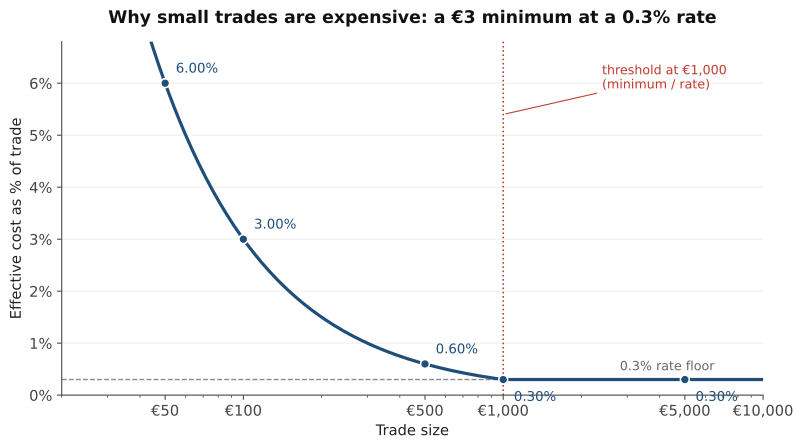
The fee has two parts: a percentage that scales with trade size, and a flat minimum that doesn’t. On a large trade, the percentage is the bigger of the two and the investor pays that. On a small trade, the percentage shrinks until the flat minimum becomes the binding charge, and the investor pays the minimum instead. Same minimum either way, but the smaller the trade, the larger a share of it that minimum represents.
Take a broker charging 0.3% with a €3 minimum. On a €5,000 trade the percentage works out to €15, which is what the investor pays. On a €100 trade the percentage works out to €0.30, but the €3 minimum takes over. The cost is still €3, except now it’s 3% of the trade instead of 0.3%. Two trades at the same broker on the same fee schedule, and one costs ten times as much per euro moved. The two parts cross over at €1,000, where 0.3% equals €3 exactly. Below that, the minimum is the binding charge and the cost ratio rises steeply.
Estimating your own
Industry averages are useful for orientation, but the number that actually belongs in any long-horizon projection is the investor’s own. It can be reconstructed from the broker’s fee schedule and a live quote, without waiting for a statement. Open the broker’s fee schedule and note the percentage commission and the per-order minimum for an EU ETF trade. Pull up a live quote, compute (ask − bid) / mid-price, and halve it for the one-way spread. If the ETF trades in a currency other than the account’s base currency, add the broker’s FX markup, which runs 0.03%–0.25% at the competitive EU discount brokers and 0.5%–1.0% at banks. Sum the pieces, divide by trade size, and convert to a percentage.
What matters for FX is the trading currency of the share class, not what the fund holds underneath. The iShares Core S&P 500 UCITS ETF trades as SXR8 on Xetra in EUR and as CSPX on the London Stock Exchange in USD. Same basket of stocks, different ticker, different trading currency, different cost to the investor.
| Component | SXR8 (EUR, Xetra) | CSPX (USD, LSE) |
|---|---|---|
| Commission | 0.10% | 0.10% |
| Half-spread | 0.03% | 0.03% |
| FX markup (EUR → USD) | 0.00% | 0.15% |
| All-in cost | ~0.13% | ~0.28% |
Roughly twice the per-trade cost for the USD share class, paid on every contribution and every rebalance for the life of the plan. Both share classes track the same index. For a euro-funded investor, SXR8 is the cheaper way to access it.
The numbers in the table describe a percentage-fee discount broker on a mid-size ticket in one of the most liquid ETFs in Europe. The 0.10% commission is in line with Saxo’s Classic schedule and Interactive Brokers’ tiered pricing, and would drop to a few basis points at flat-fee brokers like Trade Republic or DEGIRO Core Selection. The half-spread is anchored to the Xetra Liquidity Measure, which currently reports SXR8 round-trip spreads of 5–7 basis points, so 0.03% one-way is a realistic working figure. The 0.15% FX markup matches Trading 212 and Trade Republic’s published rates and sits in the middle of the European discount-broker range cited earlier.
The 0.13% all-in figure for SXR8 is close to the lower bound of what’s achievable in European retail conditions, because SXR8 is among the most liquid ETFs on Xetra and the assumed broker is on the cheaper end. A real plan holds several ETFs, some of which are an order of magnitude less liquid (small-cap, emerging-market, factor, bond), where the half-spread alone can run 10–25 basis points. Monthly contributions in small tickets push the per-trade figure higher still, because the per-order minimum binds. The default below is meant to cover those conditions, not the best instrument on its primary listing.
A reasonable default for the all-in per-trade cost, when the calculation isn’t worth doing, is 0.3% for a typical European retail investor running a multi-ETF portfolio through an EU discount broker with no FX involved. The Schwarz et al. range of 0.07%–0.46% is execution quality alone, with zero commission, so adding a discount broker’s commission on top lands the working figure near the middle of that interval. Adjust down to 0.15%–0.20% for a single very liquid holding traded in mid-size tickets at a competitive broker, up to 0.40%–0.50% for USD share classes funded in EUR at a discount broker, and 0.50%–1.0% if the broker is a bank.
The TER
The Total Expense Ratio is the annual percentage the ETF manager deducts to run the fund, covering management, custody, administration, audit, and the index licence. It is quoted as an annual rate but applied continuously, with the NAV trimmed by a small amount every business day so that the cumulative deduction across the year equals the TER. Nothing shows up on a statement because the cost is taken from the fund’s price before that price is quoted.
A few things sit outside the TER. The fund’s own internal trading costs when it rebalances, which are small for index funds and bigger for active ones. Tracking difference. Withholding taxes on dividends. All real costs, all paid out of the same NAV. Securities lending cuts the other way: some ETFs lend their holdings and rebate part of the income back, so the net drag can come in slightly under the published TER.
The platform layer
Picking ETFs, opening the right account, and deciding when to rebalance is work that not every investor wants to do. A managed platform, often called a robo-advisor, does it on the client’s behalf. The price is an annual percentage of the account, deducted continuously in the same way the TER comes out of a fund. European platforms typically charge 0.25%–1.0% per year for the service.
The platform fee and the TER are separate charges paid to separate parties. The fund company takes its TER out of the NAV. The platform takes its fee out of the account. Run a portfolio with a 0.20% average TER through a platform charging 0.75% and the total continuous drag is 0.95% per year, before any trading costs. Move to cheaper funds and the TER part comes down. The platform fee stays where it is.
A statement won’t always present one clean number. Some platforms quote a single all-in figure, others split it into management, service, and custody lines, each small enough on its own to look harmless. They add up. For a like-for-like comparison across providers, sum the TER, the platform fee, and the expected trading costs, all as annual percentages.
That combined number is what belongs in the chart in the next section, not the TER alone. Holding the funds directly at a 0.30% total drag (a cheap index ETF and no platform), €10,000 invested at 5% gross for 25 years ends near €30,000. Run the same euros through a platform charging 0.75% on top of a 0.30% TER (1.05% total drag) and the terminal balance lands near €24,000. The €6,000 gap is the cost of letting someone else pick and maintain the funds.
How it compounds
A 1% annual cost over 25 years subtracts more than 25% from terminal wealth because of compounding. The euros lost in year one can’t earn returns in years two through twenty-five, and the gap widens every year the position is held.
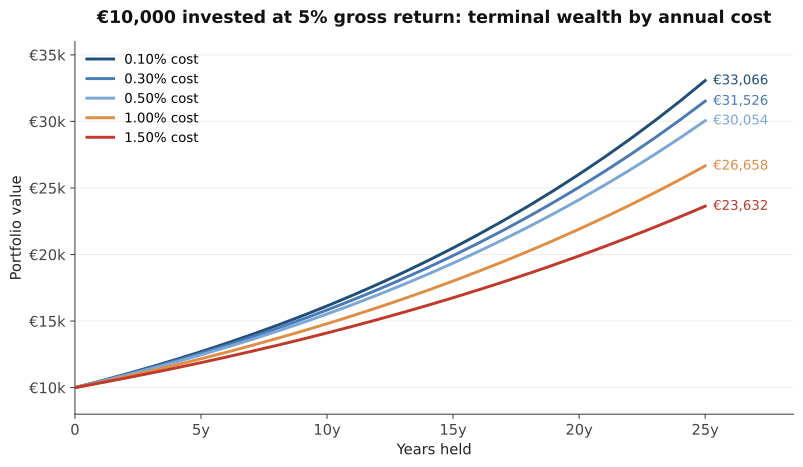
€10,000 invested at a steady 5% gross return ends 25 years later somewhere between roughly €33,000 at 0.10% cost and €23,600 at 1.50%. A €9,400 spread, driven entirely by the cost rate. Adding one percentage point of cost, from 0.30% to 1.30%, gives up about €7,400 in this example, nearly three times what a flat 25-year drag would suggest, because the compounding runs against the costs as well as the returns.
So far the discussion has stayed inside the ETF universe, where ongoing charges are low by design. For context on what “low” means, the ESMA 2025 report puts the average ongoing charge for an equity UCITS ETF around 0.3% and the average actively managed equity UCITS mutual fund around 1.4%. A structural one-percentage-point gap, paid every year, between passive ETF investing and the active fund category most European investors are offered through banks and advisers. Plug it into the chart above and, over a typical investing horizon, that gap accounts for a substantial share of terminal wealth.
Two things follow from the shape of the curve. TER matters more the longer the horizon: over a year, the gap between 0.05% and 0.25% is rounding error, but over thirty years it’s tens of percent of terminal wealth. Trading costs matter more the higher the turnover: a plan that rebalances quarterly with small trades pays the toll many times over, while a plan that rebalances annually with larger trades pays it once.
Most of these costs are choices, not facts of nature. The TER is set by which fund the investor picks. The trading bill is set by which broker the investor uses, which share class they hold, and how often they touch the portfolio. The published commission, taken on its own, understates the real bill across a long horizon.
References
Ben-David, I., Franzoni, F., & Moussawi, R. (2017). Exchange-traded funds. Annual Review of Financial Economics, 9, 169–189. https://doi.org/10.1146/annurev-financial-110716-032538
Deutsche Börse. Xetra Liquidity Measure (XLM). https://www.xetra.com/xetra-en/trading/market-quality/xlm-xetra-liquidity-measure
European Securities and Markets Authority (2025). Market Report on Costs and Performance of EU Retail Investment Products 2025. https://www.esma.europa.eu/
Saxo Bank. ETF commissions and conditions. https://www.home.saxo/rates-and-conditions/etf/commissions
Schwarz, C., Barber, B. M., Huang, X., Jorion, P., & Odean, T. (2025). The “actual retail price” of equity trades. The Journal of Finance, 80(5), 2507–2541. https://doi.org/10.1111/jofi.13467
Trading 212. FX fee on Invest accounts. https://helpcentre.trading212.com/hc/en-us/articles/360018909758